


Description
Complete Lesson Plans and All Activities!
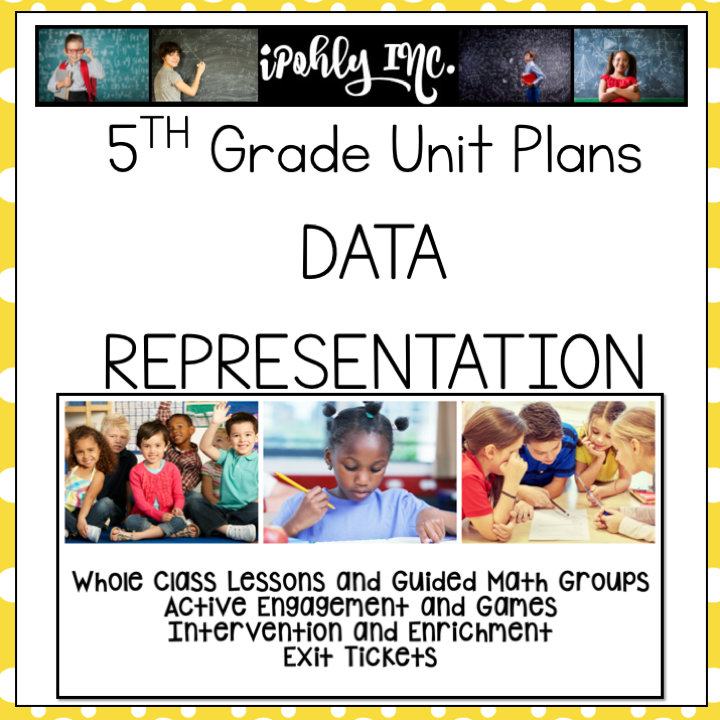
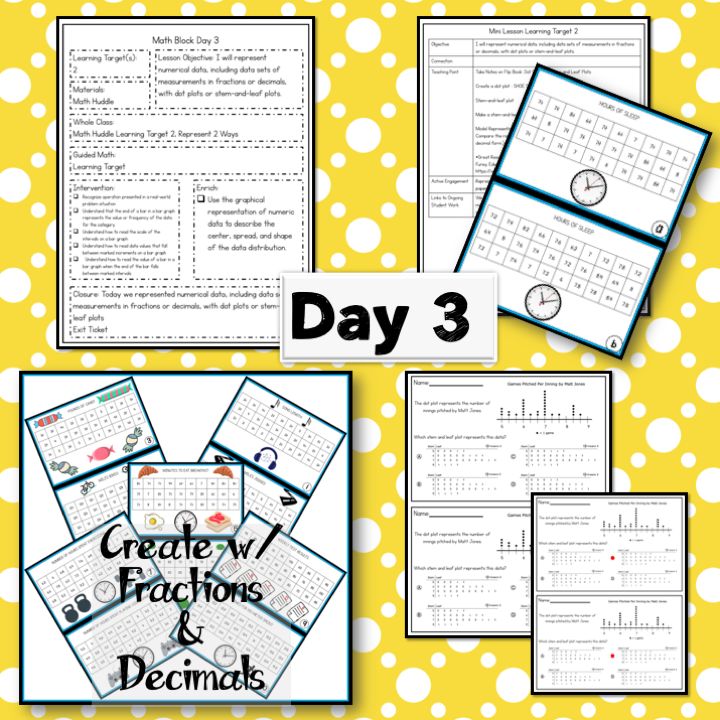
This unit is about represent data in multiple ways. Students work with familiar representations of categorical data such as frequency tables and bar graphs. They also work with numerical data represented in dot plots and stem-and- leaf plots. The scatter plot is new to 5th graders this year to represent discrete paired data. They solve one and two step problems with using data in whole number, decimal and fraction form using all of these types of graphs.
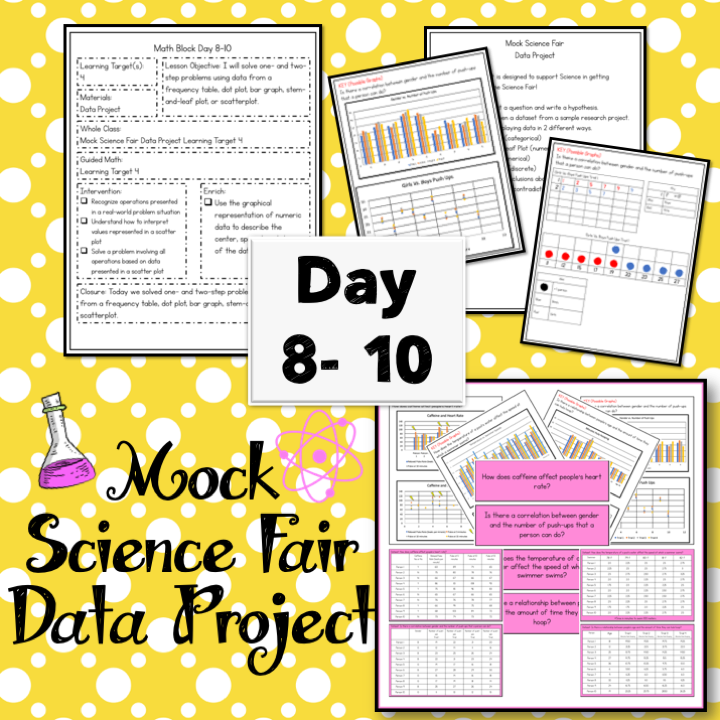
This unit contains a cross-curricular project! Mock Science Fair- get kids ready to represent their data in multiple ways to support their hypothesis!
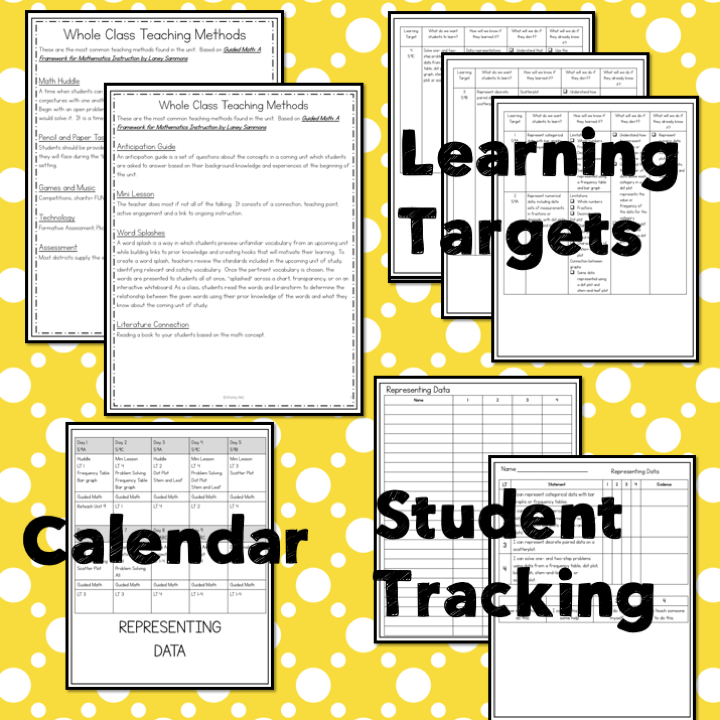
In this unit the Texas TEKS are split into specific learning goals, making it simpler to follow students’ progress. There are four skills in this unit. Each learning goal includes both intervention and advanced skills. Students can use a data sheet to think about their own learning in the unit, and teachers have a tracking sheet to help with small group instruction. This makes personalized instruction easier because students know what they need to work on.
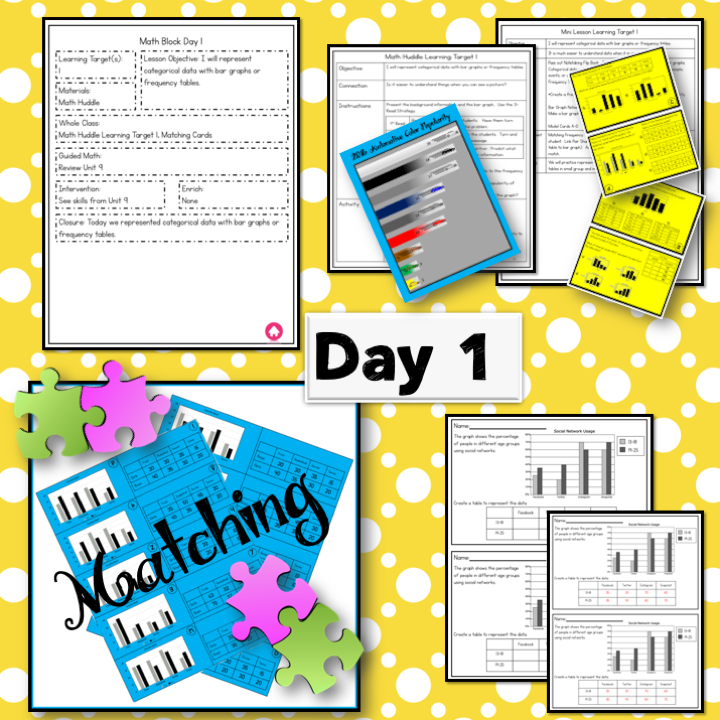
Each day contains objective, learning targets, materials, whole class teaching activity, guided math activity and closure with an exit ticket and answer key for most days.
Whole Class teaching in this unit contains:
Mini Lessons
- Connection
- Teaching Point
- Active Engagement
- Link to Ongoing Learning
Games and Engagement Activities in this unit include:
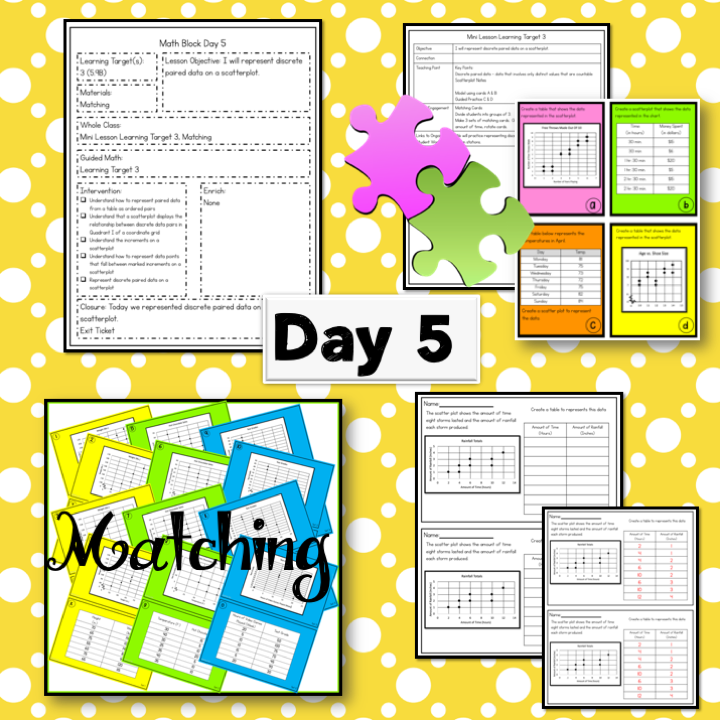
- Matching Cards 5.9A
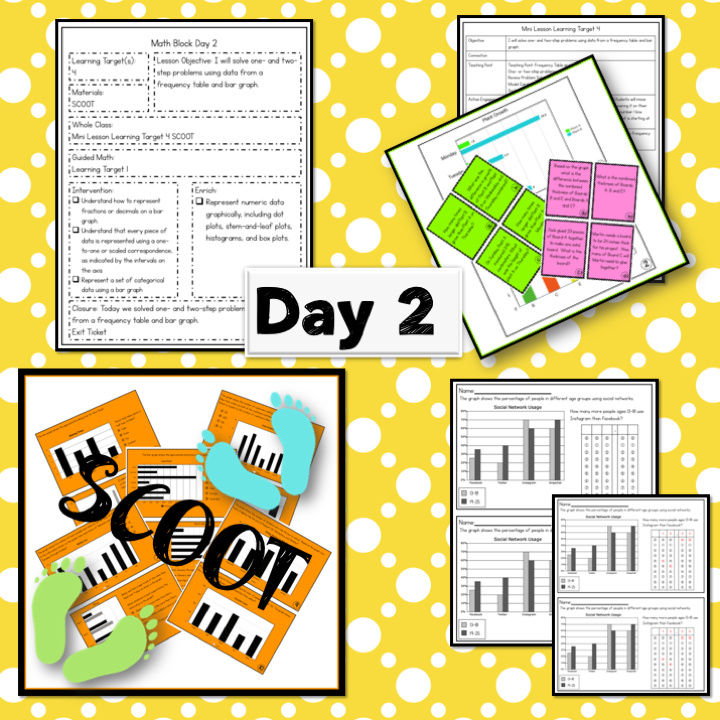
- SCOOT 5.9C
- Represent 2 Ways 5.9A
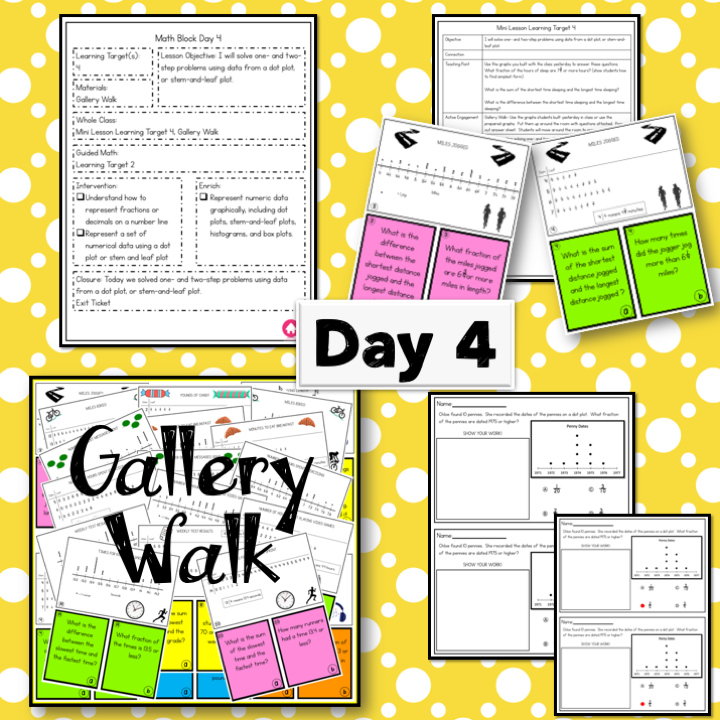
- Gallery Walk 5.9C
- Mystery Challenge 5.9C
- Matching Cards 5.9B
- Mock Science Fair Data Project 5.9ABC
This unit is designed to print and go! I keep mine in a binder. You can put each day and all of the materials for that day in one sheet protector.
I hope this unit helps you with Guided Math by providing a whole class teach, active engagement, guided math activities and exit tickets for almost everyday- you can’t beat $1.50 per day for a complete unit!
Complete Lesson Plans
TEKS: 5.9A 5.9B 5.9C
5.9(A) represent categorical data with bar graphs or frequency tables and numerical data, including data sets of measurements in fractions or decimals, with dot plots or stem-and-leaf plots
5.9(B) represent discrete paired data on a scatterplot
5.9(C) solve one- and two-step problems using data from a frequency table, dot plot, bar graph, stem-and-leaf plot, or scatterplot