3.5(E) represent real-world relationships using number pairs in a table and verbal descriptions
Okay… now what? This is the first time students in Texas are learning about this very important topic! You are teaching the baby beginnings of slope. We don’t write “rules” for the table, but they are expected to verbally describe the table. Students are looking at a different type of pattern. We are beginning to form algebraic thinking- and kids can do it! In second grade, students looked at patterns in one set of numbers. For example, 2,4,6,8… this pattern is skip counting by two. Basically they were looking at the output without looking at the input. If we put this pattern in an input/output table it would look like this:
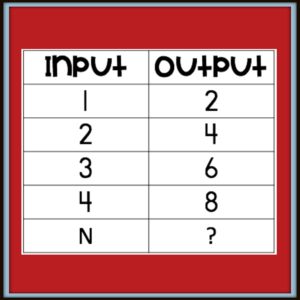
The 2 is the first number in the pattern, the 4 is the second and so on. We need to teach kids to look at the relationship between the input and the output. This table shows the output is 2 times the input. It also shows the input is half (divided by 2) of the output. Tricky! The key is to teach kids to look at the “between” relationship! If they look for a pattern in the output only, they will say the pattern is adding 2. The input is adding one.
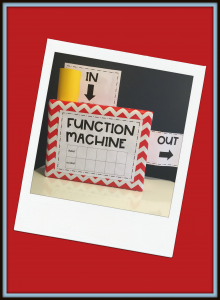 To get started teaching this concept, I start with a function machine. I used to call it a mystery machine, but now I want students to hear the word function and associate it with this type of table. I put numbers in and a new number comes out! The students try to find out what happens to the number while it is in the box (between). I ask, “What happens to the number when it is between the input tube and the output tube?” I also give them some sort of reference because this makes learning more concrete. Like- John saw a car with 4 wheels. #1 goes in and #4 comes out. Then I say, ” John saw 2 cars.” #2 goes in and #8 comes out. I record the numbers in the input/output table. It is important to label the table with cars and wheels under the words input and output. I teach both types of relationships- additive and multiplicative this way. It is important to vary the direction of the table- for some reason, students freak out when the table goes vertical. They are used to reading left to right and don’t always see the relationship as up and down! So make sure you don’t tell them not to read up and down!
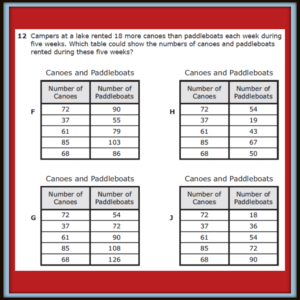
The verbal description to the table is the key! The canoe and paddleboats problem on the 2016 STAAR test caused a big problem across the state. Only 43{ead11f5758ba27f8b85d16bb338278bf88aa311cb7529b45aa5c71cfd4587f47} of third graders found the correct answer. 28{ead11f5758ba27f8b85d16bb338278bf88aa311cb7529b45aa5c71cfd4587f47} of the students picked F- This answers shows the relationship of +18 (that was what they were looking for) but it was backwards! F shows 18 more paddleboats than canoes, but the problem asked them to find 18 more canoes than paddleboats. The verbal description is important! That is why I never do tables without a verbal description!
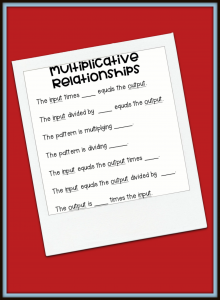
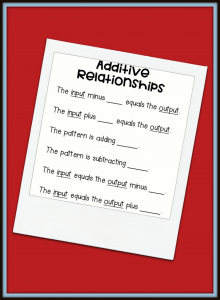 I use sentence stems in the classroom to help kids write their own verbal descriptions. The language is weird. It takes some getting used to- and the students need to be able to write it using the inverse of the operations like- The (input) is half of the (output) or the (output) is 2 times the (input). I teach them to substitute the labels and write the verbal descriptions.
Would you like a sample of one of the resources I use in my small group for working with additive relationships? Click on the image below for the PDF.
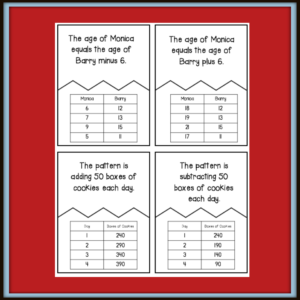
Additive Relationship Small Group Work Puzzle
If you want your weekends back and would like the plans for the entire unit, you can find them here: